Vancouver Island & Mainland Inlets
Chum salmon and steelhead are well-below average while Chinook are above average
Vancouver Island & Mainland Inlets is one of two regions where Chinook are above the long-term average. Many Chinook populations are doing exceptionally well in this region, including in the Cowichan River where record numbers are returning after near extinction in 2009. However, some populations are experiencing concerning declines and three Vancouver Island Chinook populations were recently assessed as Threatened or Endangered† by the Committee on the Status of Endangered Wildlife in Canada.
Commercial fisheries in this region harvest a mix of salmon returning to rivers on Vancouver Island & Mainland Inlets and the Fraser or U.S. rivers, making it difficult to assign catch to this region and calculate total abundance. As a result, our assessment of salmon in this region is based on spawner abundances only.
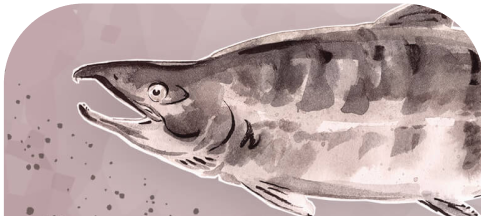
The outlook for pink salmon is very positive, which reflects broader changes in the North Pacific, where pink salmon are the most abundant species of Pacific salmon†. However, pink salmon abundance tends to fluctuate more than other species and can change dramatically from year to year.
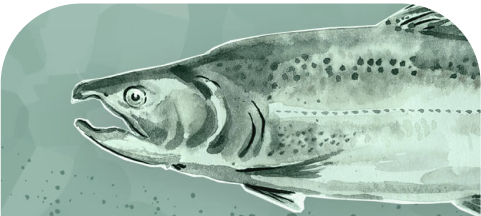
All other species are below or well-below the long-term average, with chum salmon and steelhead having experienced the most severe declines. Chum spawners have declined dramatically over the short-term, with 2022 spawner abundance reaching lows not seen since the 1960s.


State of Salmon - Vancouver Island & Mainland Inlets

OUR APPROACH
There are different ways to measure the state of salmon, and each approach tells us something unique about how salmon are doing.
CURRENT STATE is the spawner or total abundance over the most recent generation as a per cent anomaly from the long-term average and provides information on how abundant salmon are now relative to past years.
TRENDS measure the direction of change, either over the short-term (most recent three generations) or long-term (all available years). This is complementary information to the current state, and a species that has a declining trend may be a conservation concern even if the current status is above average.
Click on a species for an interpretation of the current state and trends.
Arrows indicate if the trend in abundance is increasing or decreasing
A horizontal line indicates if the trend in abundance is stable
A question mark indicates an unknown current state or trend due to a lack of readily accessible data


SPECIES NOT PRESENT
SPECIES NOT PRESENT
SPECIES NOT PRESENT
SPECIES NOT PRESENT
SPECIES NOT PRESENT
SPECIES NOT PRESENT
SPECIES NOT PRESENT
SPECIES NOT PRESENT
SPECIES NOT PRESENT
SPECIES NOT PRESENT
SPECIES NOT PRESENT
SPECIES NOT PRESENT
How to Interpret this Graph
Each fish above shows the per cent anomaly of current spawner or total abundance over the most recent generation compared to the long-term average (horizontal line) for each region and species.
Interested in more learning more? Check out the Pacific Salmon Explorer for a data-driven look at Pacific salmon Conservation Units and their habitats within each region.
For more details on our assessment approach, view our Methods.
Well-above long-term average. No conservation concern.
Above long-term average. Current outlook is good.
At or near long-term average. Precaution is warranted.
Below long-term average. Current outlook is poor.
Well-below long-term average. Significant conservation concern.
Unknown current state due to a lack of readily accessible data.

REGION PROFILE
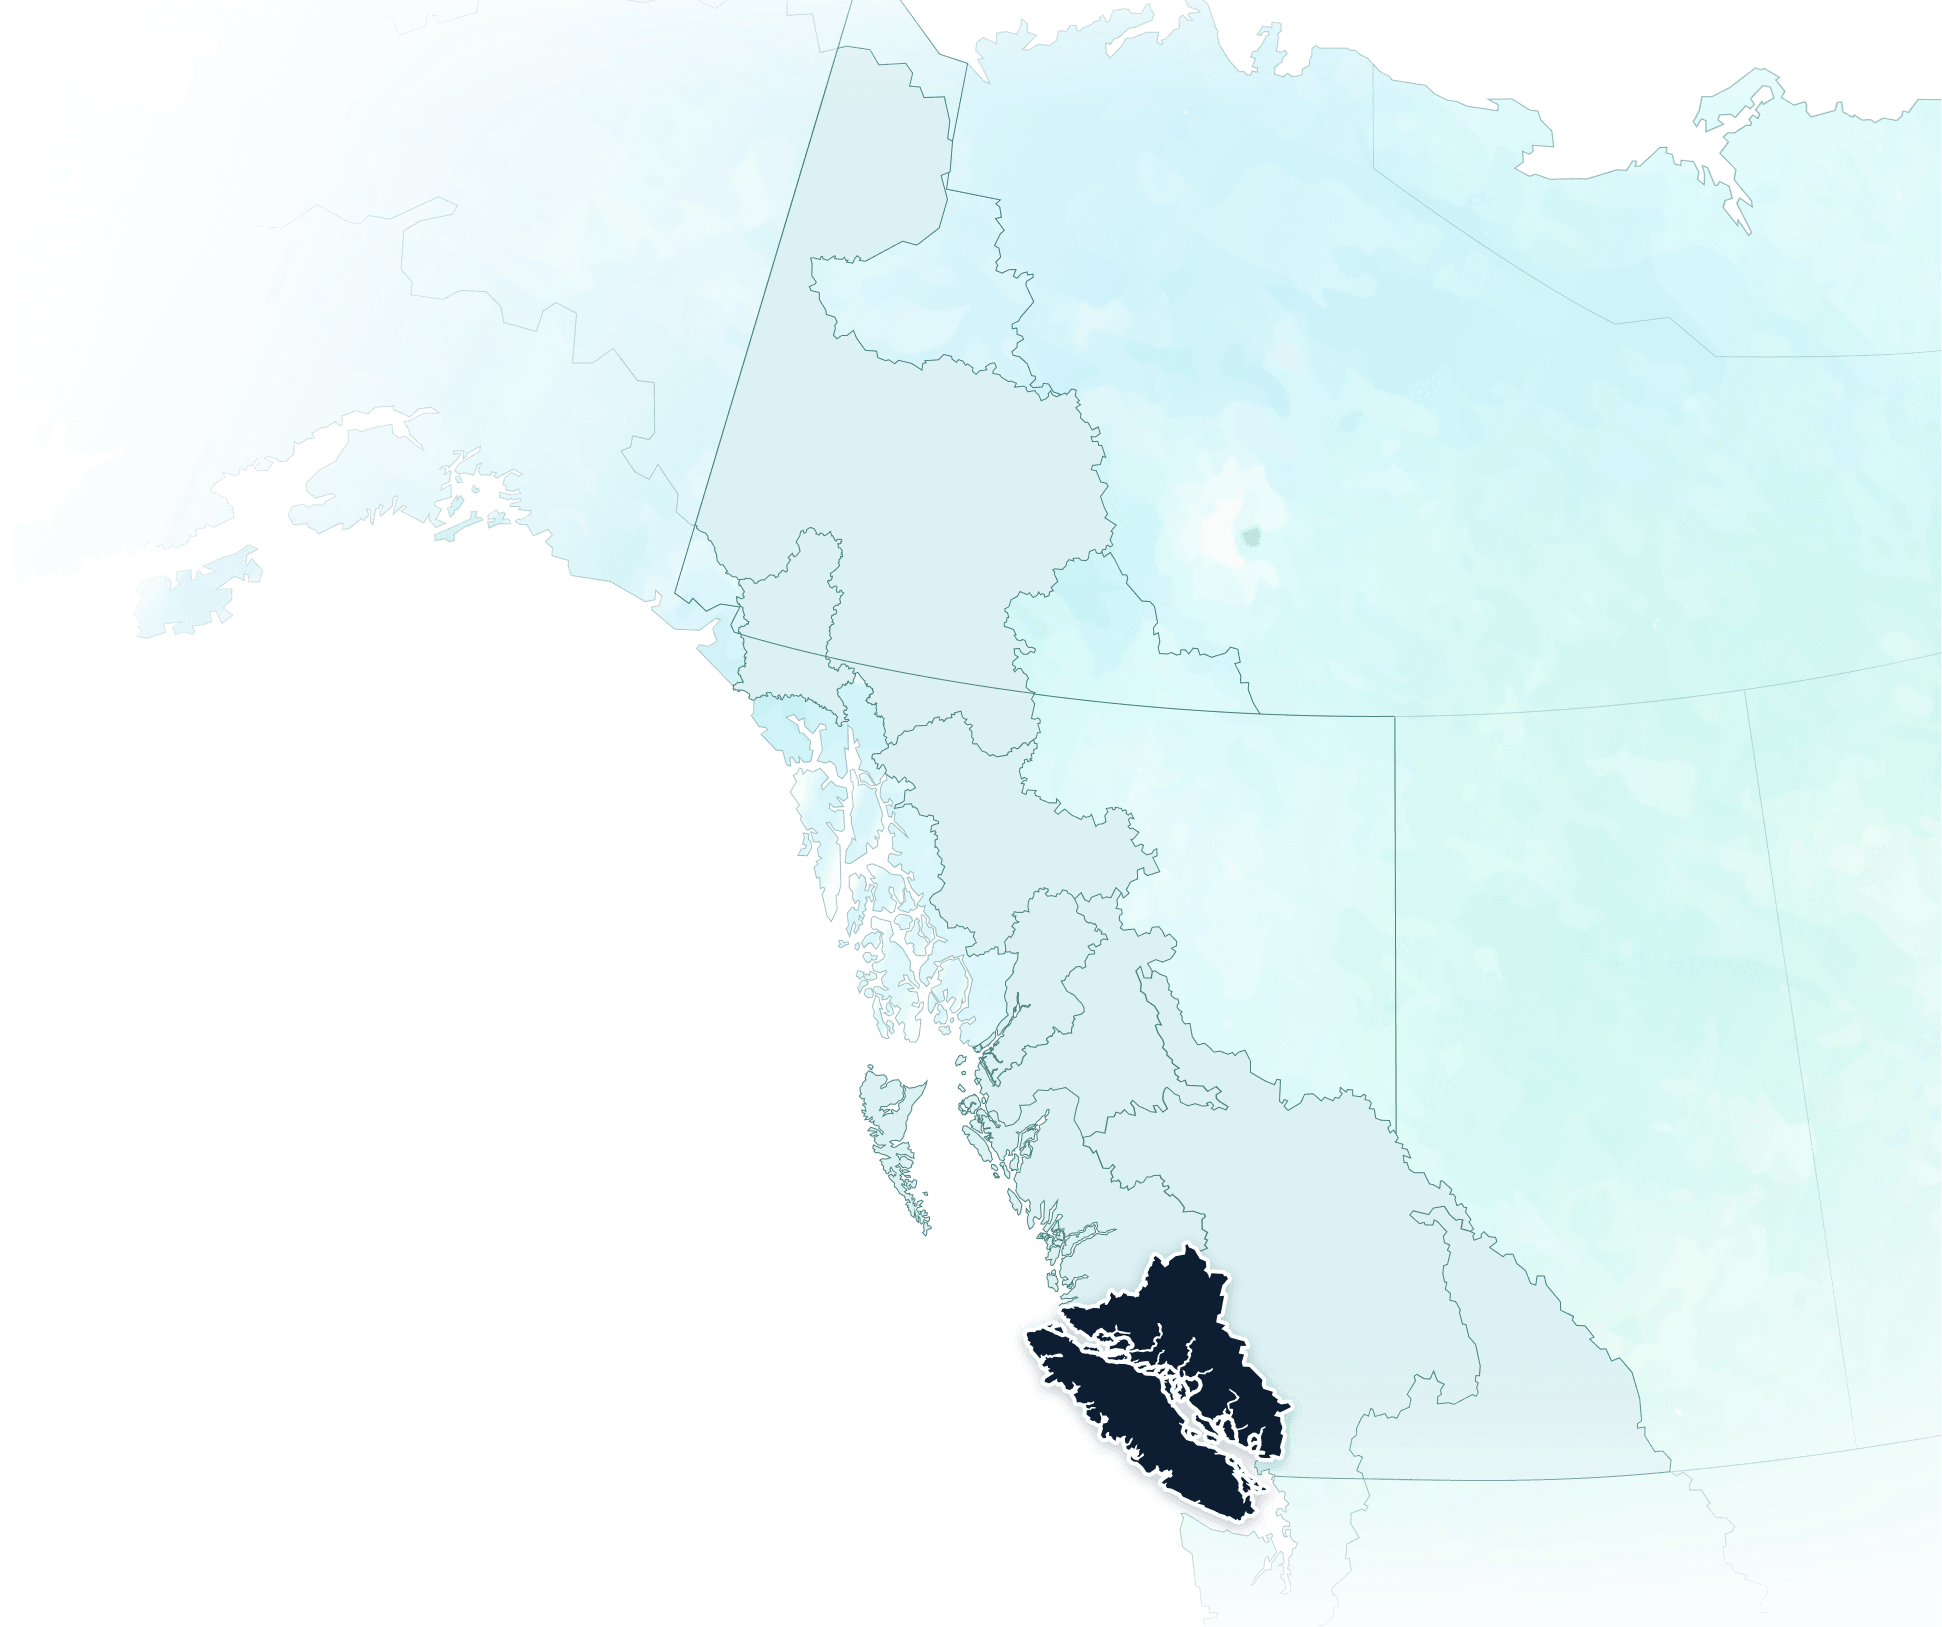
Vancouver Island & Mainland Inlets
Conservation Units are irreplaceable groups of salmon that have unique genetic and life-history traits. Maintaining multiple Conservation Units within a region strengthens the resilience of the species as a whole and helps it withstand and adapt to changing conditions. The number of Conservation Units provides a good indication of the salmon biodiversity in the region.
SPECIES NOT PRESENT
Major Salmon-Bearing Rivers
The Vancouver Island & Mainland Inlets Region encompasses 76,411 square kilometres across Vancouver Island and the adjacent mainland fjords and inlets, from Burrard Inlet and Howe Sound in the south, to Smith Inlet and the northern Broughton Archipelago in the north. This drainage area ranges from large, glacier-fed streams in the mainland inlets to small coastal streams on Vancouver Island.
Many salmon from the region spend their early years in the Salish Sea, a semi-enclosed sea between Vancouver Island and the mainland, with a significant freshwater influence from the Fraser River. Most of these salmon exit the Salish Sea through Johnstone Strait in the north. The Salish Sea was once a highly productive place for salmon but, beginning in the 1970s, marine survival rates for Chinook, coho, and steelhead dropped sharply. Recent research suggests that climate-driven changes to the salmon food supply and a dramatic increase in predators are the two most significant issues killing juvenile salmon†.
On the west coast of Vancouver Island, Chinook salmon reach more than 13 kilograms. They support socially and economically valuable fisheries from the west coast of Vancouver Island northward to southeast Alaska.